Text display
import matplotlib.pyplot as plt
import numpy as np
import matplotlib as mp

plt.rcParams['text.usetex'] = False

x = np.linspace(0, 2*np.pi, 100)
y = np.cos(x)
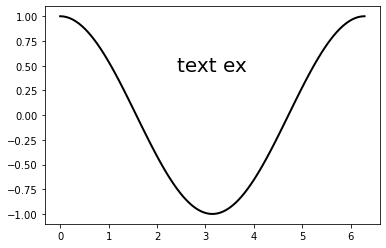
Text in data coordinates
Text in data coordinates is written by using the text method.
plt.figure()
ax = plt.gca()
plt.plot(x, y)
# text in data coordinates
plt.text(np.pi, 0.5, 'text ex', fontsize=20,
         ha='center', va='center')
plt.show()
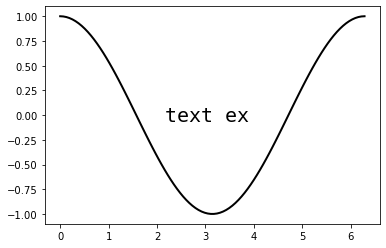
Text in figure coordinates
Text in data coordinates is written by using the figtext method.
plt.figure()
ax = plt.gca()
plt.plot(x, y)
# text in figure coordinates (ranging from 0 to 1)

from matplotlib.font_manager import FontProperties
myfont = FontProperties()
myfont.set_family('monospace')

plt.figtext(0.5, 0.5, 'text ex', fontsize=20,
            ha='center', va='center', fontproperties=myfont)
plt.show()

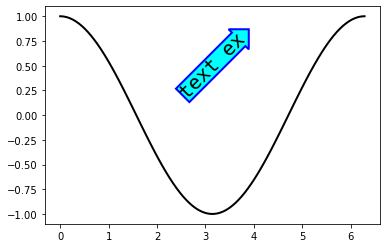
Bounding box
To enclose your text within fancy box, set the bbox argument, which is a dictionary of box settings
# property for bounding box
bbox_prop = dict(boxstyle="rarrow, pad=0.0", fc="cyan", ec="b", lw=2)

plt.figure()
ax = plt.gca()
plt.plot(x, y)
# text in data coordinates (ranging from 0 to 1)
plt.text(np.pi, 0.5, 'text ex', fontsize=20, family='monospace',
         ha='center', va='center', rotation=45, bbox=bbox_prop)
plt.show()
Changing fonts
To change the font property, set the fontproperties argument, which takes amatplotlib.font_manager.FontProperties object.
import matplotlib.font_manager as mpfm

plt.figure()
ax = plt.gca()
plt.plot(x, y)

myfont = mpfm.FontProperties()
myfont.set_family('monospace')

plt.figtext(0.5, 0.5, 'text ex', fontsize=20,
            ha='center', va='center', fontproperties=myfont)

plt.show()
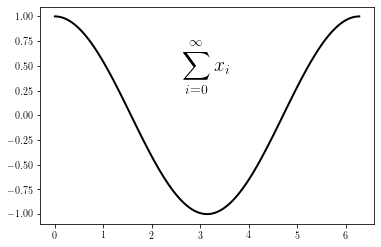
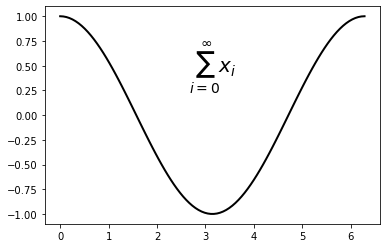
Mathematical text
To add mathematical formulae, put your text between $ symbols.
plt.figure()
ax = plt.gca()
plt.plot(x, y)
plt.text(np.pi, 0.5, r'$\sum_{i=0}^\infty x_i$', fontsize=20,
         ha='center', va='center')
plt.show()
You can also use TeX rendering by setting to True the text.usetex key of the Matplotlib parameters.
Warning! To use TeX rendering, latex and dvipng need to be installed.
Note that in case of TeX rendering, mathematical formulae starts with $\displaystyle and and with $
plt.rcParams['text.usetex'] = True

plt.figure()
ax = plt.gca()
plt.plot(x, y)
plt.text(np.pi, 0.5, r'$\displaystyle \sum_{i=0}^\infty x_i$', fontsize=20,
    ha='center', va='center')
plt.show()