Working with NEMO files
Here are some examples for plotting outputs on a NEMO grid.
Building variable
Let’s first build a bathymetric field using the vertical scale factors.
import numpy as np
import matplotlib.pyplot as plt
import xarray as xr
import cartopy.feature as cfeature
import cartopy.crs as ccrs

data = xr.open_dataset('data/mesh_mask_eORCA1_v2.2.nc')
data = data.isel(t=0)
tmask = data['tmask'].values
e3t = data['e3t_0'].values
lon = data['glamt'].values
lat = data['gphit'].values

bathy = np.sum(e3t * tmask, axis=0)
bathy = np.ma.masked_where(bathy == 0, bathy)
First try
If we first try to use the pcolormesh as we learned, here is what comes out:
fig = plt.figure(figsize=(12, 15))
ax = plt.axes(projection=ccrs.PlateCarree())
cs = ax.pcolormesh(lon, lat, bathy, transform=ccrs.PlateCarree())
ax.add_feature(cfeature.LAND, zorder=50)
ax.add_feature(cfeature.COASTLINE, zorder=51)
cb = plt.colorbar(cs, shrink=0.3)
/home/barrier/Softwares/anaconda3/lib/python3.7/site-packages/cartopy/mpl/geoaxes.py:1797: MatplotlibDeprecationWarning: shading='flat' when X and Y have the same dimensions as C is deprecated since 3.3.  Either specify the corners of the quadrilaterals with X and Y, or pass shading='auto', 'nearest' or 'gouraud', or set rcParams['pcolor.shading'].  This will become an error two minor releases later.
  result = matplotlib.axes.Axes.pcolormesh(self, *args, **kwargs)
We have an error message saying that the longitudes and latitudes are not monotonic. Let’s improve our figure.
Better way
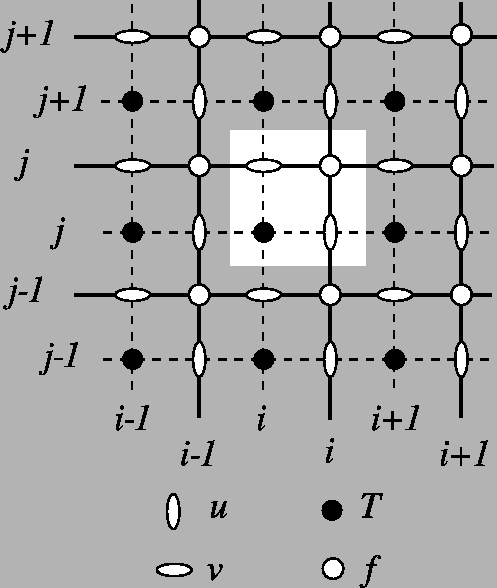
As indicated in the documentation, the pcolormesh method assumes the following layout:
(X[i+1, j], Y[i+1, j])          (X[i+1, j+1], Y[i+1, j+1])
                      +--------+
                      | C[i,j] |
                      +--------+
    (X[i, j], Y[i, j])          (X[i, j+1], Y[i, j+1])
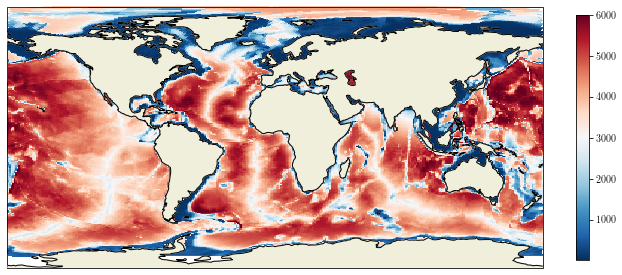
Therefore, the good way to draw is to provide the coordinates of the F points (upper-right corners), and to give a sub-array of T points.
Grid layout of NEMO outputs:
lonf = data['glamf'].data
latf = data['gphif'].data
fig = plt.figure()
ax = plt.axes(projection=ccrs.PlateCarree(central_longitude=0))
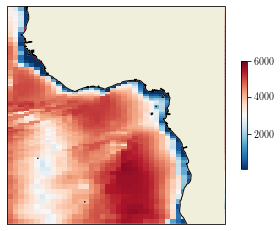
cs = ax.pcolormesh(lonf, latf, bathy[1:, 1:], transform=ccrs.PlateCarree(), shading='flat')
ax.set_extent([-20, 20, -20, 20], crs=ccrs.PlateCarree())
ax.add_feature(cfeature.COASTLINE, zorder=2)
ax.add_feature(cfeature.LAND, zorder=1)
cb = plt.colorbar(cs, shrink=0.5)
Contour plots
However, the drawing of contour plots is not simple on irregular grid. Instead, we need to use the
tricontour method, as indicated here.
First, we recover the coordinates on the T points, not on the F points as for pcolormesh.
lont = data['glamt'].data
latt = data['gphit'].data
Then, we extract the data mask.
mask = (np.ma.getmaskarray(bathy))
Now, we extract the bathy, longitudes and latitudes on wet points and we convert into 1D arrays:
lon1d = np.ravel(lont[~mask])
lat1d = np.ravel(latt[~mask])
bat1d = np.ravel(bathy[~mask])
bat1d
masked_array(data=[121.15876481013115, 64.95892756174798,
                   515.0322590608843, ..., 24.57716311091656,
                   24.57716311091656, 24.57716311091656],
             mask=[False, False, False, ..., False, False, False],
       fill_value=1e+20)
The next step is to convert our 1D geographical coordinates (lon/lat) into the coordinates of the output map. If we want to draw our contours on a Mollweide projection:
projin = ccrs.PlateCarree()
projout = ccrs.Mollweide(central_longitude=180)
#projout = ccrs.PlateCarree(central_longitude=0)

output = projout.transform_points(projin, lon1d, lat1d)
lonout = output[..., 0]
latout = output[..., 1]
latout.shape
(65549,)
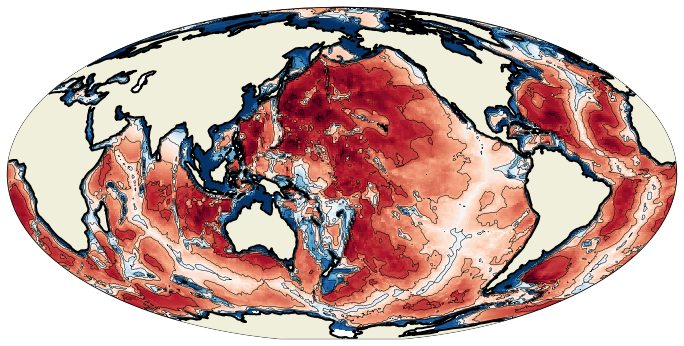
Now, we can add contours using the tricontour method:
fig = plt.figure(figsize=(12, 12))
ax = plt.axes(projection=projout)
cs = ax.pcolormesh(lonf, latf, bathy[1:, 1:], transform=projin)
cl = ax.tricontour(lonout, latout, bat1d, levels=np.arange(0, 6000 + 1000, 1000), colors='k', linewidths=0.5)
ax.add_feature(cfeature.LAND, zorder=100)
l = ax.add_feature(cfeature.COASTLINE, zorder=101, linewidth=2)