Geometrical forms
The drawing of geometrical forms is achieved by using the objects of the matplotlib.patches module.
Once a Patches object is created, it must be added to the current axes by using the add_artist method.
Warning! The limits of the axis must be set manually using the set_xlim and set_ylim methods.
import numpy as np
import matplotlib.patches as patch
import matplotlib.pyplot as plt
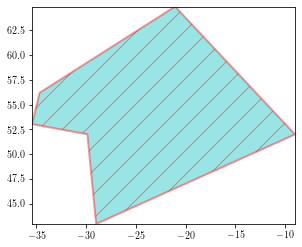
Polygons
A polygon can be draw by providing a (N, 2) array containing the X and Y coordinates.
px = np.array([-21.065, -34.685, -35.459, -29.887, -29., -29, -9])
py = np.array([64.86, 56.189, 53.036, 52.011, 43., 43,52])
xy = np.transpose(np.array([px, py])) # 7 x 2

fig = plt.figure()
ax = plt.gca()
ax.set_aspect('equal')
p = patch.Polygon(xy, closed=True,
               fill=True, hatch='/', alpha=0.4, facecolor='c',
               edgecolor='r', linewidth=2)
ax.set_xlim(px.min(), px.max())
ax.set_ylim(py.min(), py.max())
ax.add_artist(p)
plt.show()
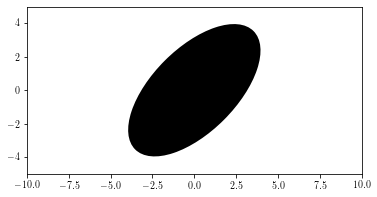
Ellipse
xy_center = [0, 0]
fig = plt.figure()
ax = plt.gca()
ax.set_aspect('equal')
plt.plot(xy_center[0], xy_center[1], marker='o', color='k', linestyle='none')
p = patch.Ellipse(xy_center, height=5, width=10, angle=45,
                  fill=True, linewidth=2)
ax.set_xlim(-10, 10)
ax.set_ylim(-5, 5)
ax.add_artist(p)
plt.show()
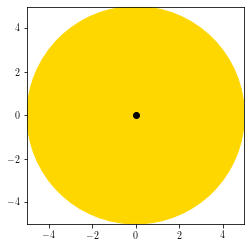
Circles
xy_center = [0, 0]

plt.figure()
ax = plt.gca()
ax.set_aspect('equal', 'box')
plt.plot(xy_center[0], xy_center[1], marker='o', color='k', linestyle='none')
p = patch.Circle(xy_center, radius=5, fill=True, color='Gold')
ax.add_artist(p)
ax.set_xlim(-5, 5)
ax.set_ylim(-5, 5)
plt.show()
Rectangles
xy_center = [0, 0]

plt.figure()
ax = plt.gca()
ax.set_aspect('equal')
plt.plot(xy_center[0], xy_center[1], marker='o', color='k', linestyle='none')
# here, coord is lower left!
p = patch.Rectangle(xy_center, height=5, width=10, angle=0,
                  fill=True, linewidth=2)
plt.xlim(0, 10)
plt.ylim(0, 5)
ax.add_artist(p)
plt.show()
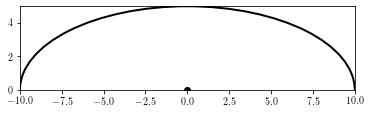
Arcs
xy_center = [0, 0]

plt.figure()
ax = plt.gca()
ax.set_aspect('equal')
# cannot be filled!
plt.plot(xy_center[0], xy_center[1], marker='o', color='k', linestyle='none')
hyp = np.sqrt(10**2 + 20**2)
p = patch.Arc(xy_center, height=10, width=20, angle=0, theta1=0, theta2=180, linewidth=2)
plt.xlim(-10, 10)
plt.ylim(0, 5)
ax.add_artist(p)
plt.show()