Changing default Matplotlib settings
In order to change the default Matplotlib settings (for instance default colors, default linewidth, etc.), the user needs to modify the values of the matplotlib.pyplot.rcParams dictionary.
For a detailed description of all the customizarion methods, visisit matplotlib webpage.
import matplotlib as mpl
import matplotlib.pyplot as plt
import numpy as np
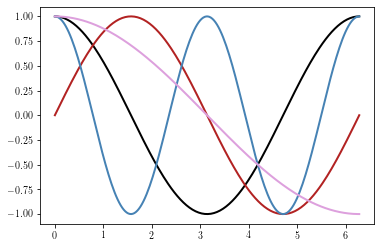
x = np.linspace(0, 2*np.pi, 200)
y = [np.cos(x), np.sin(x), np.cos(2*x), np.cos(x/2.)]
y = np.array(y).T
plt.figure()
plt.plot(x, y)
plt.show()
In a script
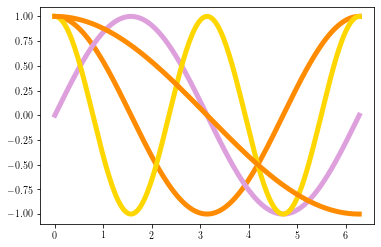
If the user wants to change the default values only within a given script, this is done as follows:
from cycler import cycler  # used to define color cycles
plt.rcParams['lines.linewidth'] = 5
plt.rcParams['axes.prop_cycle'] = cycler('color', ['darkorange', 'plum', 'gold'])
plt.figure()
plt.plot(x, y)
plt.show()
Changing the parameters for all sessions
Default matplotlib parameters are stored in a matplotlibrc configuration file. Python will search this file into 3 different locations in the following order order:
in the current working directory (usually used for specific customizations that you do not want to apply elsewhere)
$MATPLOTLIBRCif it is a file, else$MATPLOTLIBRC/matplotlibrcOn
.config/matplotlib/matplotlibrc(Linux) or.matplotlib/matplotlibrc(other platforms)
If no matplotlibrc file is found, then the default value will be used. The path of the matplotlibrc file that is used in a given session can be obtained by using the matplotlib_fname method.
print(mpl.matplotlib_fname())
/home/barrier/.config/matplotlib/matplotlibrc
To change your Matplotlib default parameters, download the sample matplotlibrc file and put it in any of the three directories described above.
Then, uncomment the lines you are interested in and change the values.